'%20stroke-width='9.5'%20stroke-linecap='round'%20stroke-linejoin='round'%20fill='none'%3e%3c/path%3e%3cpath%20d='M60,60%20C68.528,48.7%2074.318,44.475%2083.152,44.651%20C90.065,44.789%2097,49.147%2097,60%20C97,70.938%2090.073,74.743%2083.246,74.969%20C73.885,75.278%2068.272,70.71%2060,60'%20stroke='url(%23agr)'%20stroke-width='9.5'%20stroke-linecap='round'%20stroke-linejoin='round'%20fill='none'%20filter='url(%23as)'%3e%3c/path%3e%3c/svg%3e)
How AI research can help us rethink circular business models. Illustrated with the reusable wine bottle.
Business Model Innovation
Same service, different business model
During my studies, specialising in “Entrepreneurship & Innovation”, one question fascinated me above all: why does the same service work brilliantly with one business model and get completely displaced by another? What is this “business model innovation” at its core?
The textbook example is Uber versus the taxi. A ride from A to B, the service is identical. Or Airbnb versus traditional holiday rental agencies. That digitalisation plays a role is clear. But on its own it does not explain the disruptive force, and this has been discussed at length in the literature. Network effects, for example, are another building block: every additional participant makes the system more valuable for everyone else. The business model decides whether this dynamic can emerge at all.
At Thinkubator we work intensively on the economic viability of circular business models. How do we get business model innovation right so that we close material loops? Business model innovation alone is hard enough. But when it is additionally restricted by given constraints (think 10R principles) and has to be modelled towards a concrete target picture (think climate-neutral circular economy), it gets really hard.
Despite all the advantages of the circular economy described in the literature and presented at conferences, the linear model still wins far too often. Our globally declining circularity rate proves it.
Circularity is a tough nut to crack.
And more than ever I am convinced that one thing above all is needed: business model innovation. At the end of the day, a business model is a construct that moves different parties to cooperate through incentives.
How strongly incentives work is shown by the linear model. We all know the example: lamp manufacturers that build a light bulb that lasts forever threaten their own business, because the market eventually becomes saturated. So they do not invest in durability. You can think that is good or bad, and of course there are nuances and exceptions. But broadly speaking, that is the incentive situation.
That does not mean technology and regulation play no role. But if you want to implement something concrete within an existing framework, we stick to the credo: Incentives is all you need.
From Attention to Incentives
From “Attention is all you need” to “Incentives is all you need”
In my spare time I have been working with machine learning, neural networks and reinforcement learning for several years. What fascinates me is the history of the field. Decades of theoretical basic research were followed by a phase of intensive practical application. The decisive breakthrough to modern AI as we know it today finally came in 2017 with the paper “Attention Is All You Need” and the introduction of the Transformer architecture.
Put simply, it was about this. Take the sentence “The dog followed the fox into its den.” Older models processed the word sequence step by step, from left to right, and each step only referred to the one directly before it. That is difficult here, because only the context shows whom “its” refers to, the dog or the fox. By the time the models reached “its” or “den”, they had often already “forgotten” the beginning of the sentence.
This is also the problem in many linear business models. We go through the value chain from start to finish and lose sight of which point is responsible for which outcome: what effect do product design decisions have on recovery? Where does the choice of retailers determine whether a product can be taken back at all?
“Attention is all you need” turns this principle around. Every element in the sentence asks at the same time: where do I stand, and how am I related to all the others? These relationships are weighted and computed in parallel, depending on the whole context. The model looks at “its” and simultaneously draws connecting lines to “dog” and “fox” in order to compute whose den is most likely meant (context weighting).
This is exactly what we need to do in circular business models: apply context weighting when modelling. Which point relates to the others in which way? What does it need from them? And how can we incentivise it? That is the step from “Attention is all you need” to “Incentives is all you need”.
Circular business models need weighted relationships and context embedding.
That was the thought that has stayed with me since. The step from the chain to the relationship matrix in artificial intelligence is analogous to the step from the linear economy to the circular economy.
Whether the analogy holds and how far it can be pushed, I do not know. Whether tools or algorithms can be developed from it is equally open. Testing it will probably be at the core of our next projects at Thinkubator.
The Concept
The “Incentive is all you need” concept: a weighted relationship matrix instead of a supply chain
Our example: the reusable wine bottle. Almost every wine bottle in Austria becomes waste glass after a single use, even though it is usually undamaged. If winemakers, retail, hospitality and washing plants could reuse it together, a loop would emerge. We use it to explain the concept and work through it step by step in chapter 4.
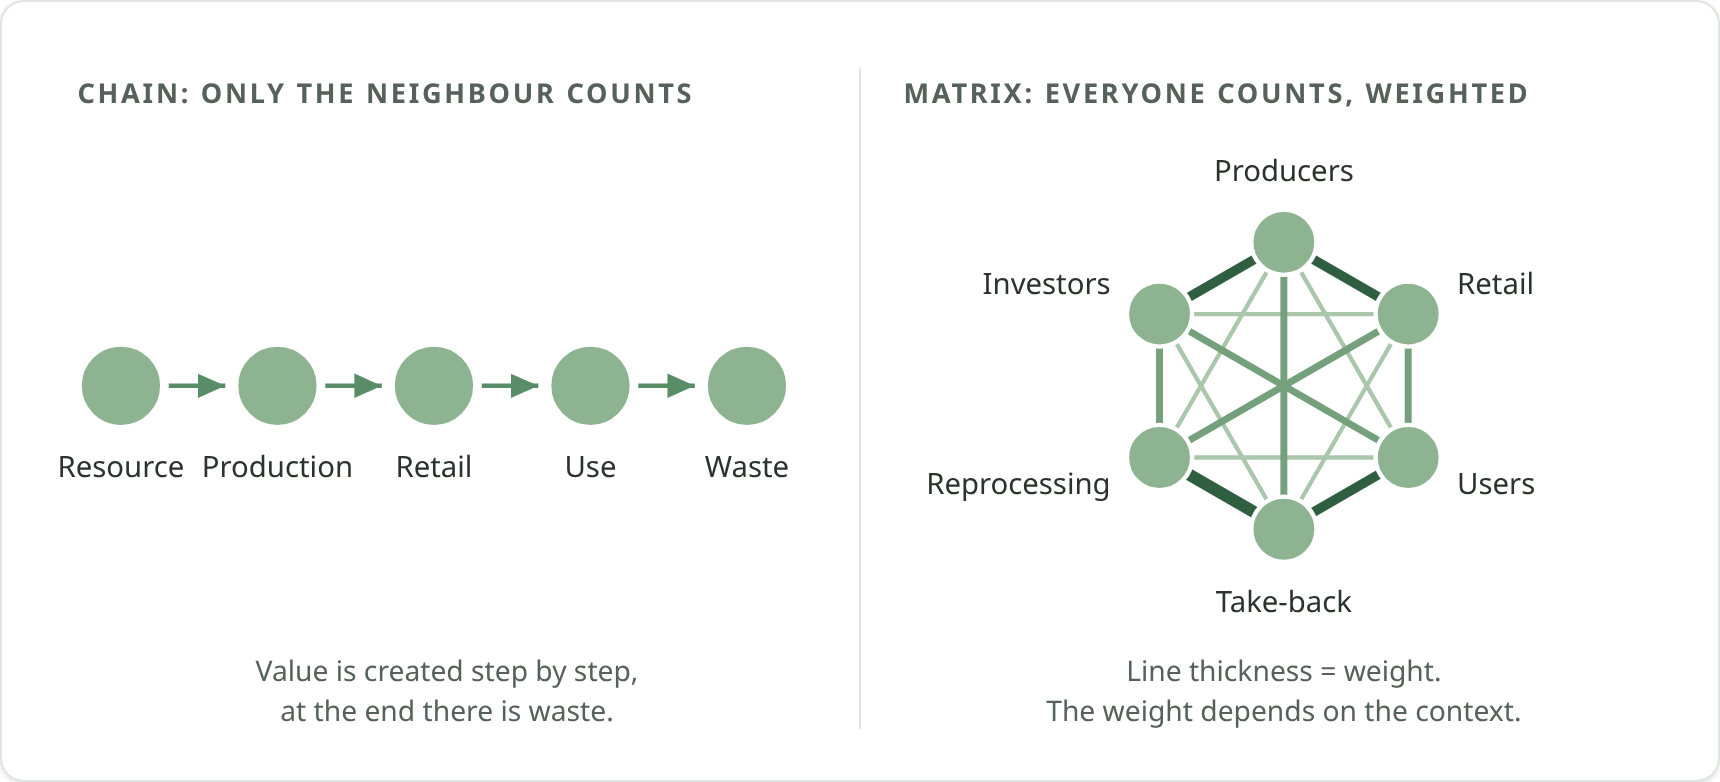
Classic value chain analysis asks: who supplies me, whom do I supply? One step up, one step down. For linear chains that is enough. In a loop, however, the value of a bottle, a battery or a component depends on many actors at the same time, and to different degrees depending on the situation. That is why I propose the Incentive-is-all-you-need concept, based on three ideas.
Own illustration. Created with Claude Design Beta (AI).
Idea 1: relationships with everyone
The framework describes a network as a matrix. The actors are the points (in network analysis, “nodes”), and the connecting lines between them are called “edges”. In the text I mostly speak of relationships. Each cell in the matrix asks: how strongly does actor A influence the economics of actor B? What matters is that this weight is not fixed. A used bottle means something different to the washing plant than to winemakers, and for both its value changes with the condition, location and timing of the bottle.
Idea 2: layers and states
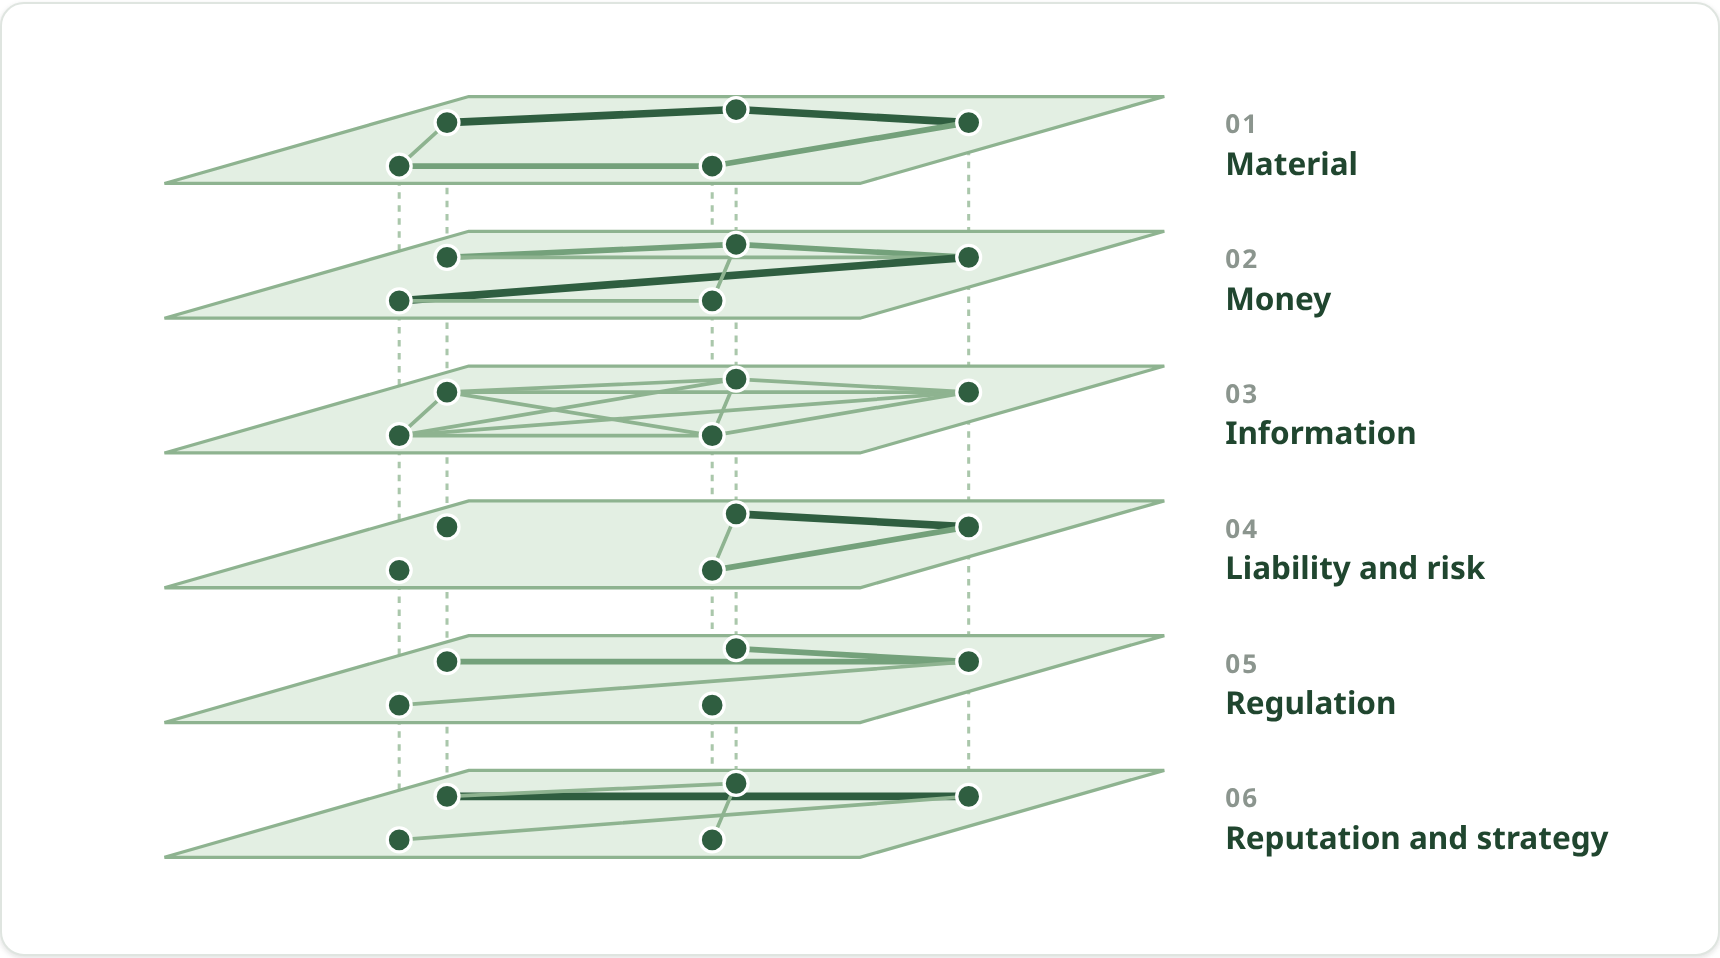
A Transformer looks at the same data with several “heads” at once, and it receives several pieces of positional information. For us the analogy is: we need not just one matrix but several layers, one per type of relationship, because relationships in business models have so many dimensions: material, money, information, liability, regulation, reputation and many more.
Every relationship is also a function of the state, that is, of location and transport costs, the quality condition of the bottle and the current situation of supply and demand. Without this information the matrix would act as if a bottle were worth the same whether it is 20 or 400 kilometres from the washing plant or whether it is damaged.
Own illustration. Created with Claude Design Beta (AI).
Idea 3: incentives as currency
The core question per relationship is: does actor B, under realistic conditions, have a reason to do what the business model assumes? That is, return bottles, collect them sorted by type, share data, guarantee a residual value. Where the answer is no, an incentive gap arises. That is exactly where the cash flow depends on someone who has no reason to play along.
Not all of this can be expressed in euros. Lobbying, image and veto power can hardly be valued in money in a meaningful way. That is why the model should work with three categories.
Class 1
Measurable in money
Prices, costs, take-back revenues.
Goes directly into the cash flow.
Class 2
Translatable into risk
Supply risk, probability of default, quality variance.
Scenarios with probabilities, shifts expected value and variance.
Class 3
Not translatable
Lobbying, image, veto power.
Rated ordinally, treated as a constraint or exclusion criterion, not converted into money.
Limits
If you build the model, the weights are expert estimates at first, not data. And once you start collecting and deriving the weights from reality, the learned weights are observed behaviour and not necessarily causality. Whoever learns from the status quo learns the linear status quo.
Case study
Case study: the reusable wine bottle
In an early edition of the Thinkubator Fellow Programme, Sebastian Seisel, Michaela Zuckerhut and Kilian Mazagg worked on the circularity of wine bottles. Almost every wine bottle in Austria becomes waste glass after a single use. This means new glass is melted, raw materials and energy are consumed, and the bottle is replaced even though it is usually undamaged.
A life cycle assessment from an Italian wine consortium concludes that reuse is superior to glass recycling in all impact categories considered.3 The avoided new production outweighs the effort for washing, sterilising and drying.
A 2005 study by the State of Styria (using mineral water as an example) reports an average of around 32 cycles for reusable glass bottles. It also notes that the ecological advantage shrinks with transport distance and that individualised bottles can hardly be refilled regionally.2
The starting point: we know that reusable systems perform better ecologically in all aspects studied, and we know that they lead to significant reuse. Added to this is the constraint of transport distance, which will become less relevant as the transport sector in Austria decarbonises.
Step 1: Constraints
The 10R principles rank strategies from “Refuse” to “Recover” according to how much material and energy they save. Three apply to the wine bottle: Rethink (changing the business model), Reduce (producing fewer new bottles) and Reuse (using the same stock several times, according to the Styrian study around 32 times on average).
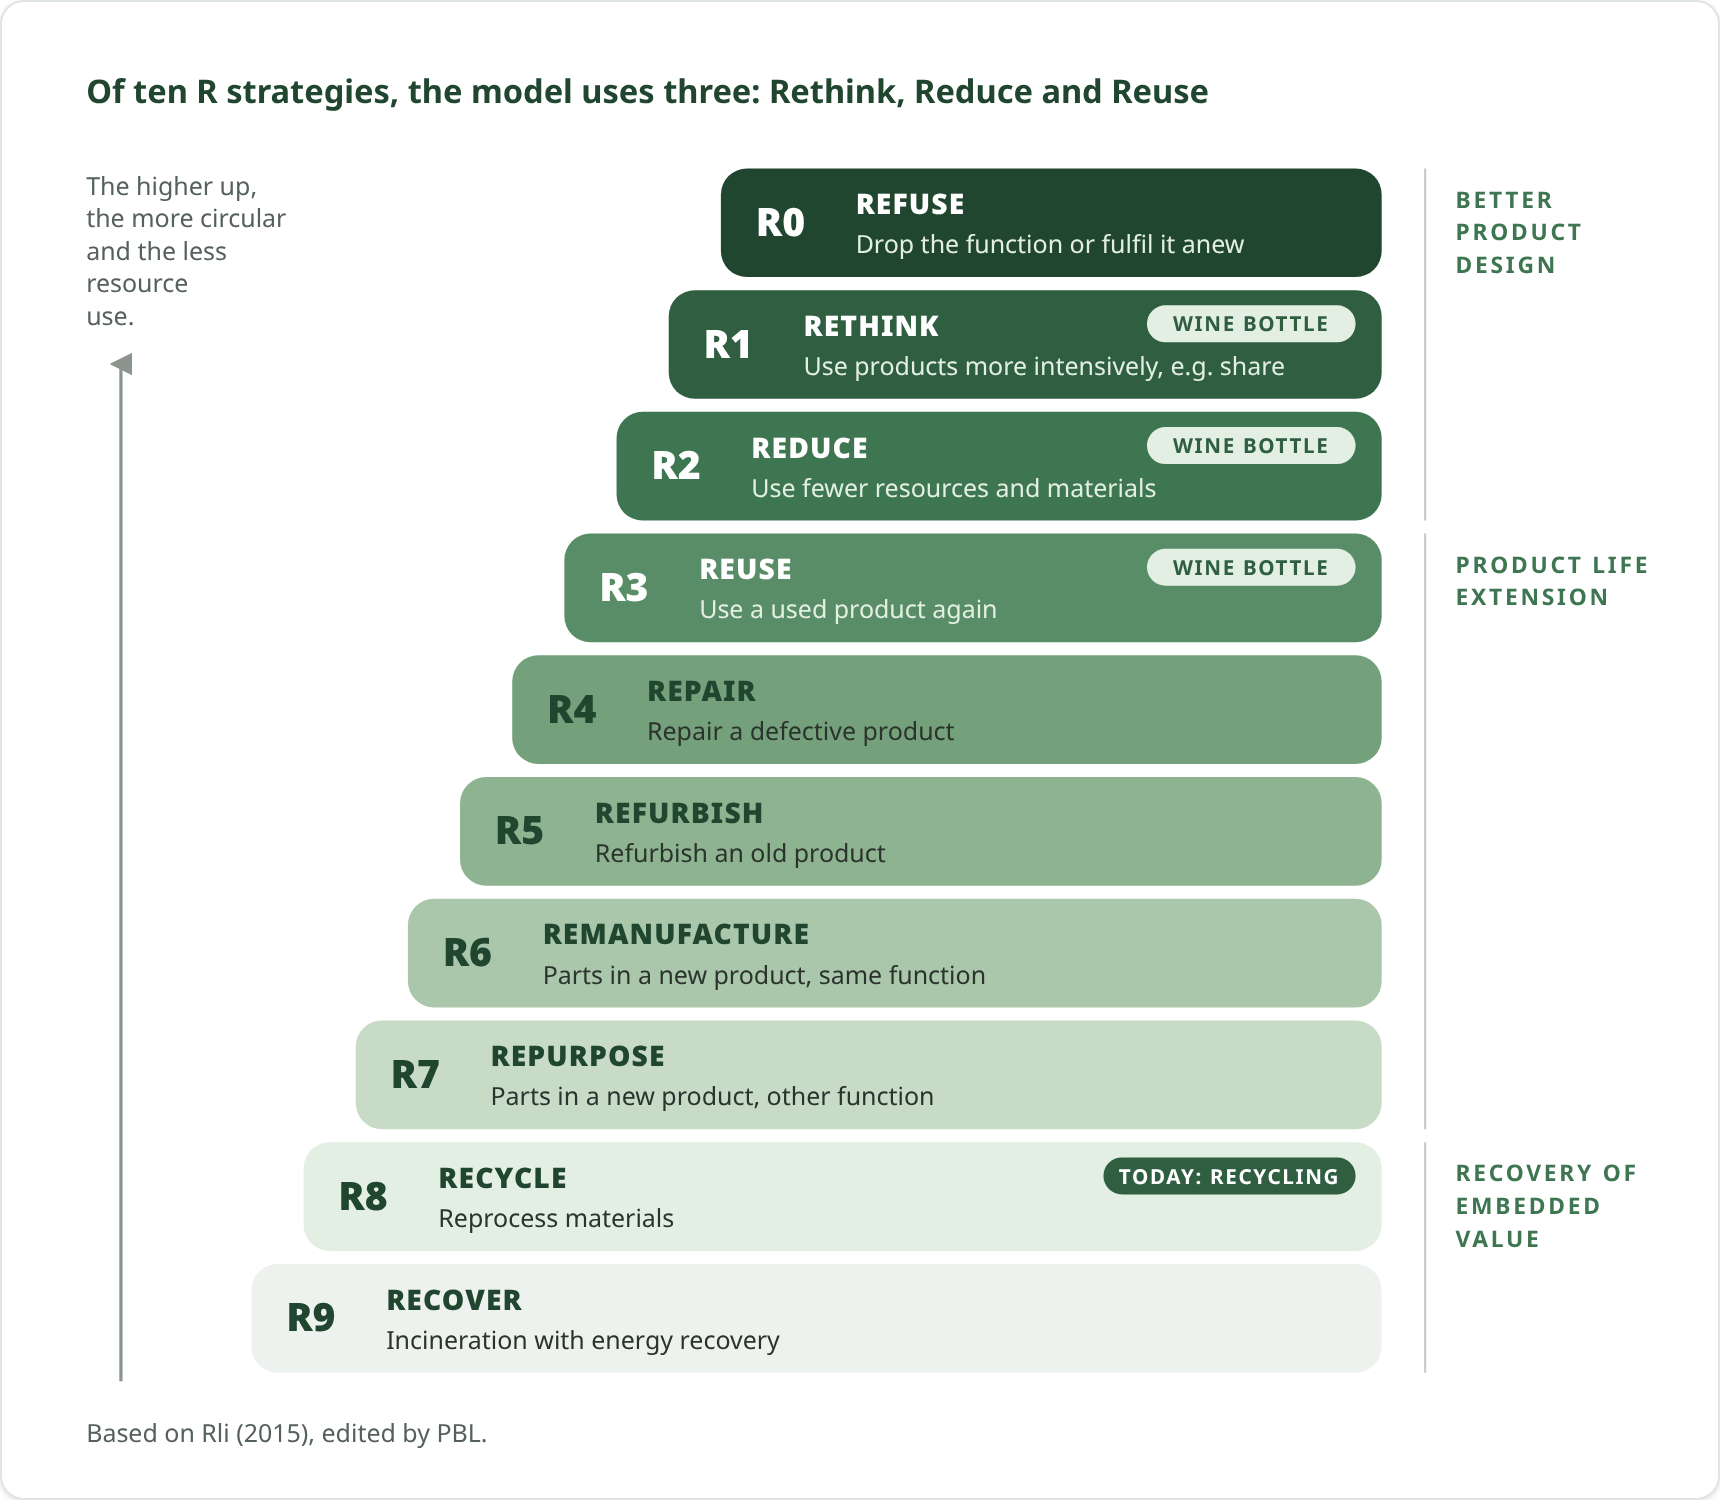
Rli (2015), edited by PBL. Created with Claude Design Beta (AI).
Today the bottle ends up in recycling, which is much lower on the ladder. Added to this is a second constraint, transport distance: the further the bottle travels to the washing plant, the smaller the advantage.
Step 2: Target picture
The target picture is the climate-neutral circular economy. The circular economy follows from the principles of step 1. For climate neutrality, the life cycle assessment from Italy helps: reuse performs better than recycling in all impact categories considered.
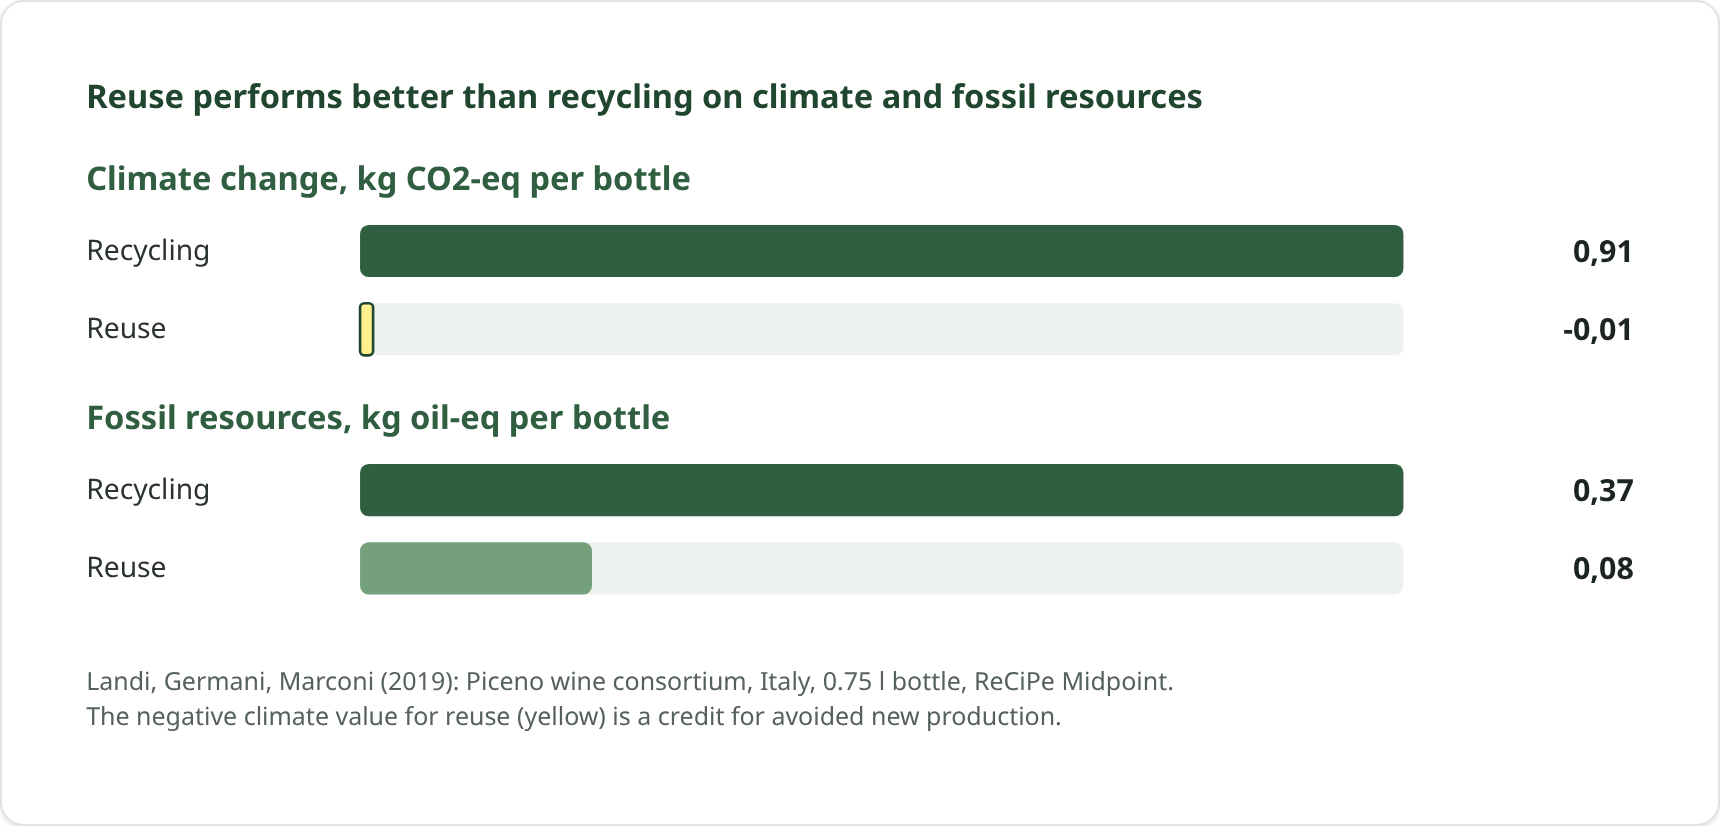
Landi, Germani, Marconi (2019), tables 2 and 3. Created with Claude Design Beta (AI).
This is not an absolute assessment. The negative climate value is a credit for avoided new production, not a real removal, and the study applies to a regionally compact case. But the direction is right.
Step 3: Value network
Now all actors come to the table, including those that seem to be on the margins at first glance. The bottle runs from manufacturers via winemakers to retail and hospitality, to consumers and via take-back and the washing plant back to winemakers. Above them are actors who move nothing and still decide: who finances, who is liable, who sets the rules.
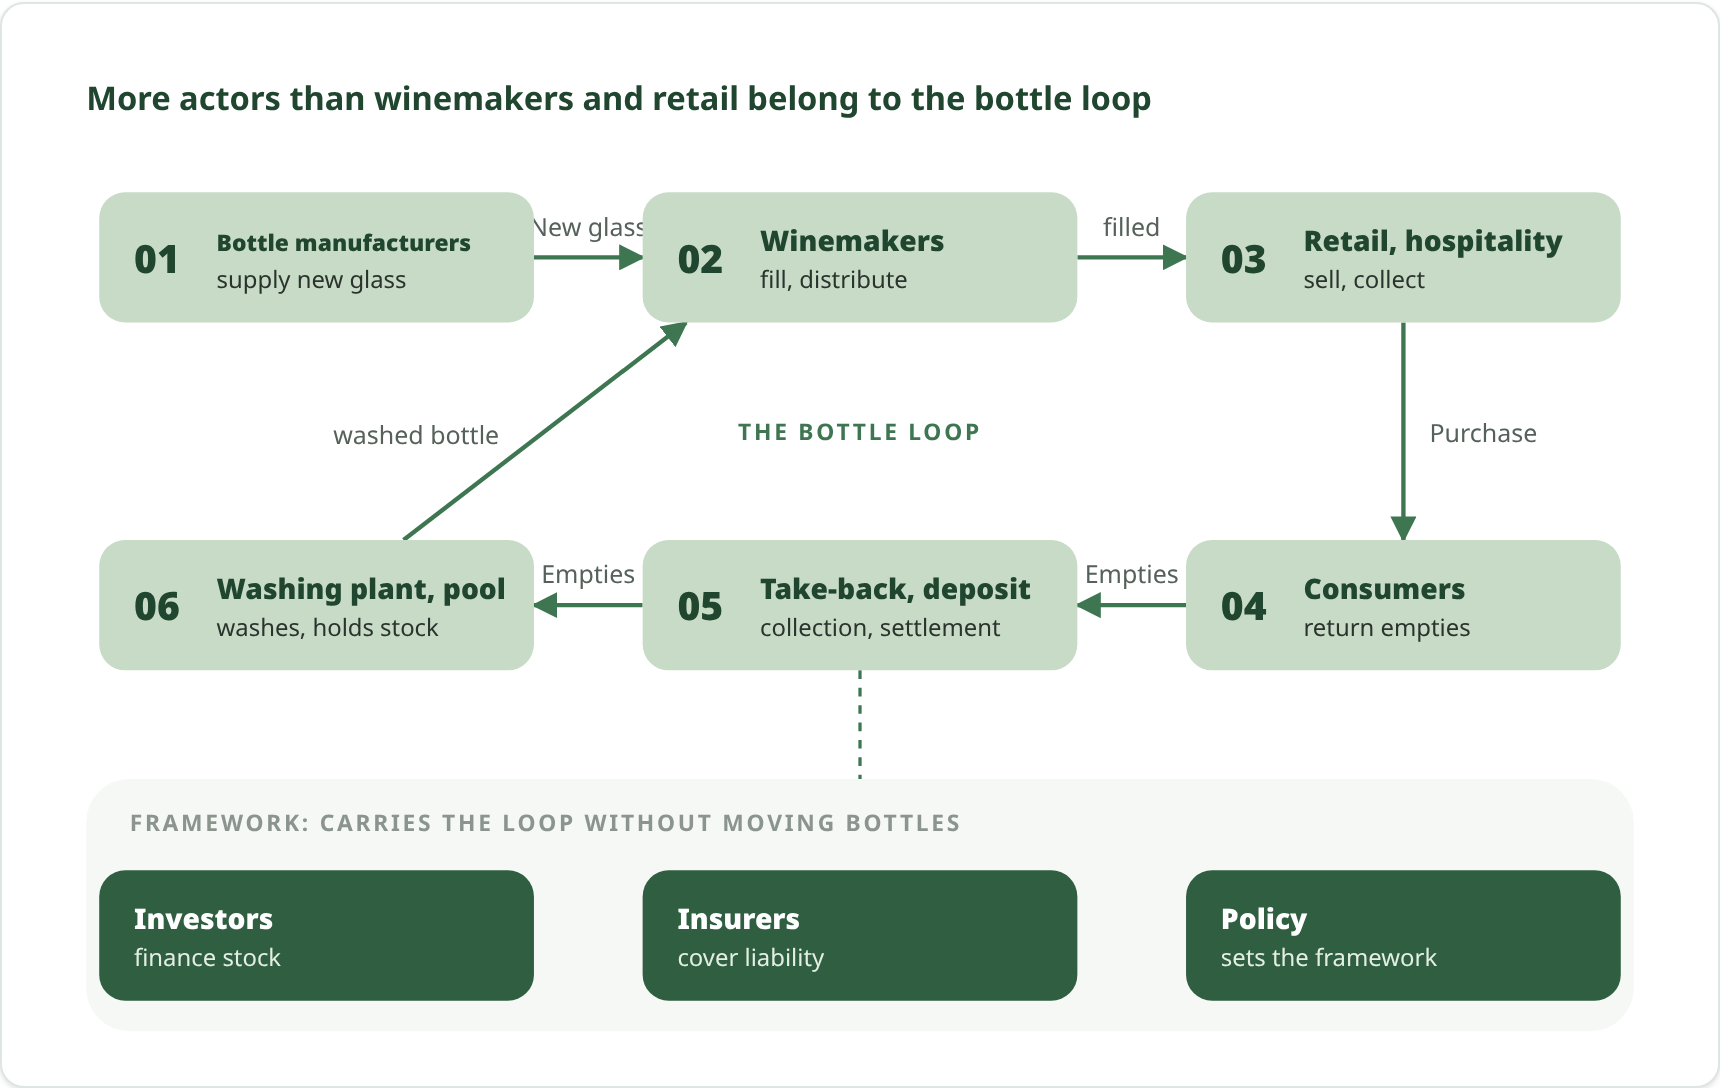
Own illustration. Created with Claude Design Beta (AI).
Step 4: Relationship layers
Between two actors there is never just one relationship. Winemakers and retail exchange bottles, money, information and liability. In our concrete case, the following layers seem sensible.
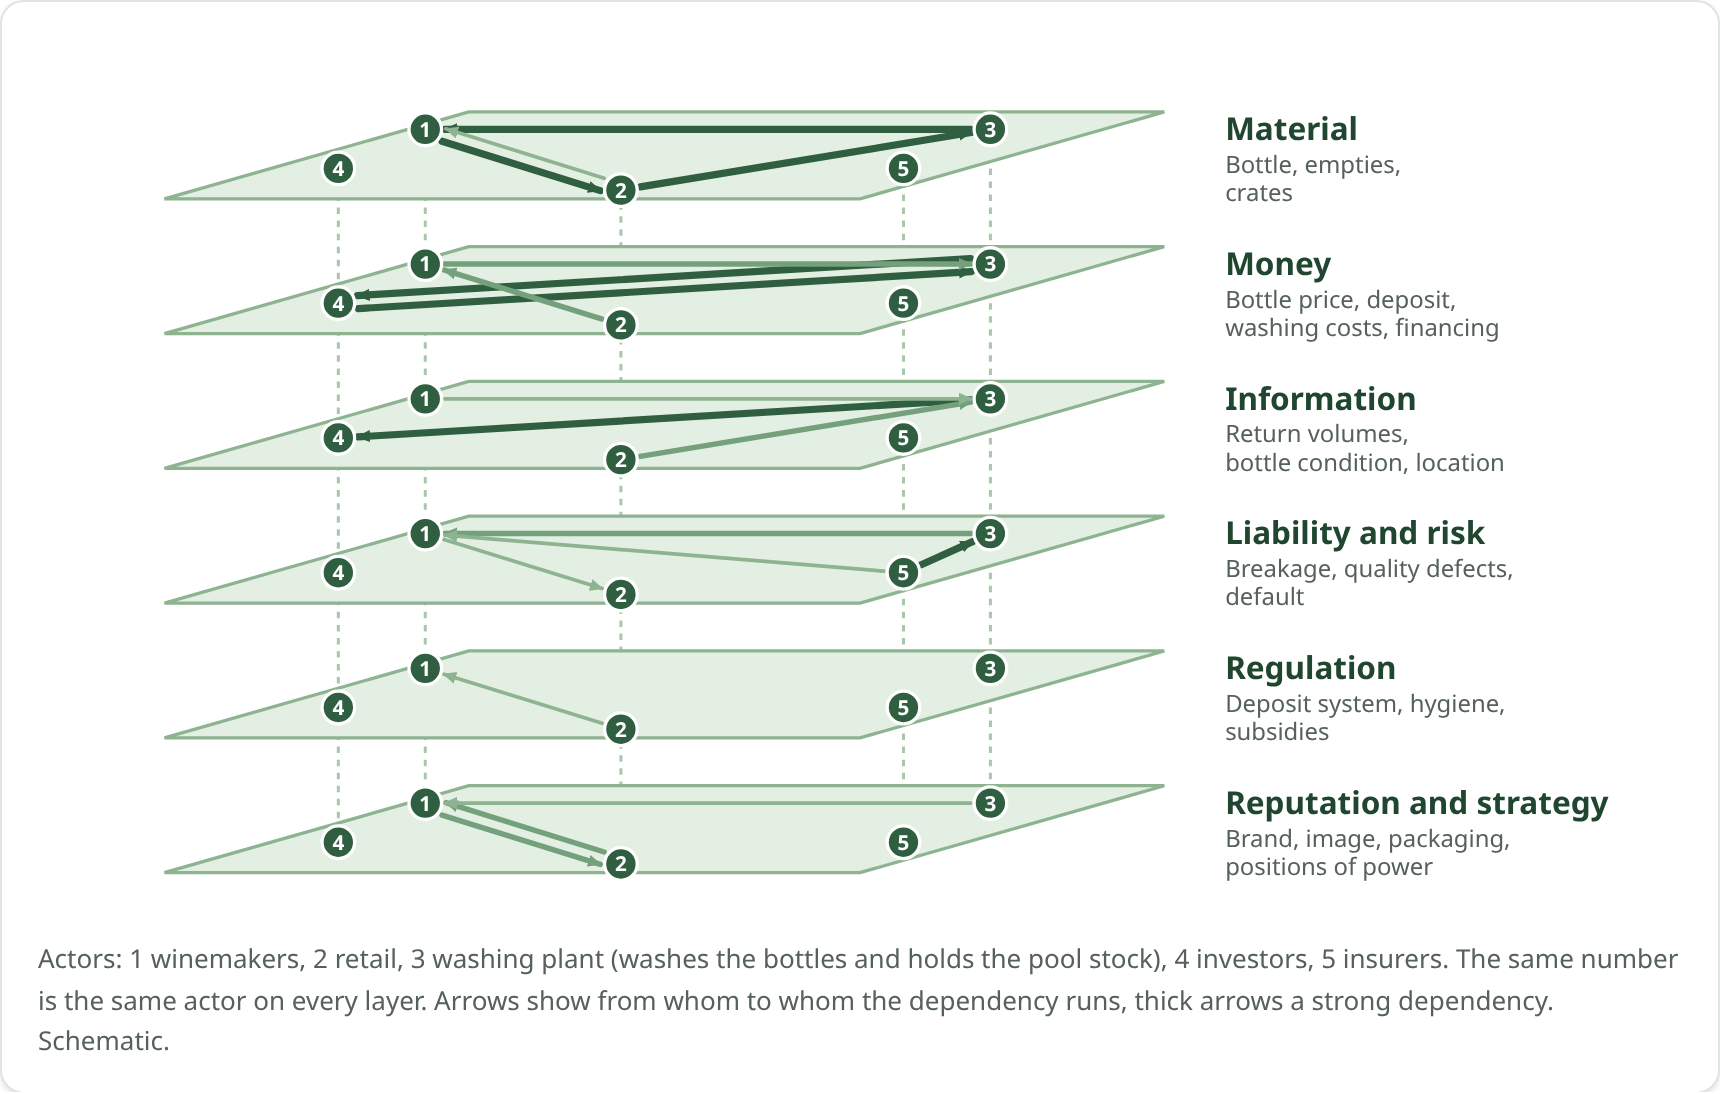
Own illustration, schematic. Created with Claude Design Beta (AI).
Each plate is a layer, i.e. a type of relationship. The same actors stand on each plate, with the same number, and the arrows show who depends on whom on that layer. Winemakers (1) and retail (2), for example, are strongly connected on the material layer because bottles and empties move between them, but hardly at all on liability. The arrows have a direction, because how strongly B depends on A is not the same as the other way round: winemakers deliver the filled bottle to retail (strong), the empties come back more weakly. Only the stack makes these differences visible. The table below lists for each layer what concretely flows for the wine bottle and which guiding question it raises.
| Layer | What flows for the wine bottle | Guiding question |
|---|---|---|
| Material | Bottle, empties, crates | Who moves the bottle where? |
| Money | Bottle price, deposit, washing costs, financing | Who pays, who earns per cycle? |
| Information | Return volumes, bottle condition, location | Who knows how many bottles are in circulation? |
| Liability and risk | Breakage, quality defects, default | Who bears the damage, who insures? |
| Regulation | Deposit system, hygiene requirements, subsidies | Which rules help, which slow things down? |
| Reputation and strategy | Brand, image, positions of power, packaging | Who loses reputation or market share? |
Step 5: Weighting
Not every layer is equally relevant for every actor. Investors want predictable cash flows and therefore look first at money and information, because without data on the number of cycles there is no reliable residual value. A public authority would probably give regulation more weight. That is the context weighting from the attention idea.
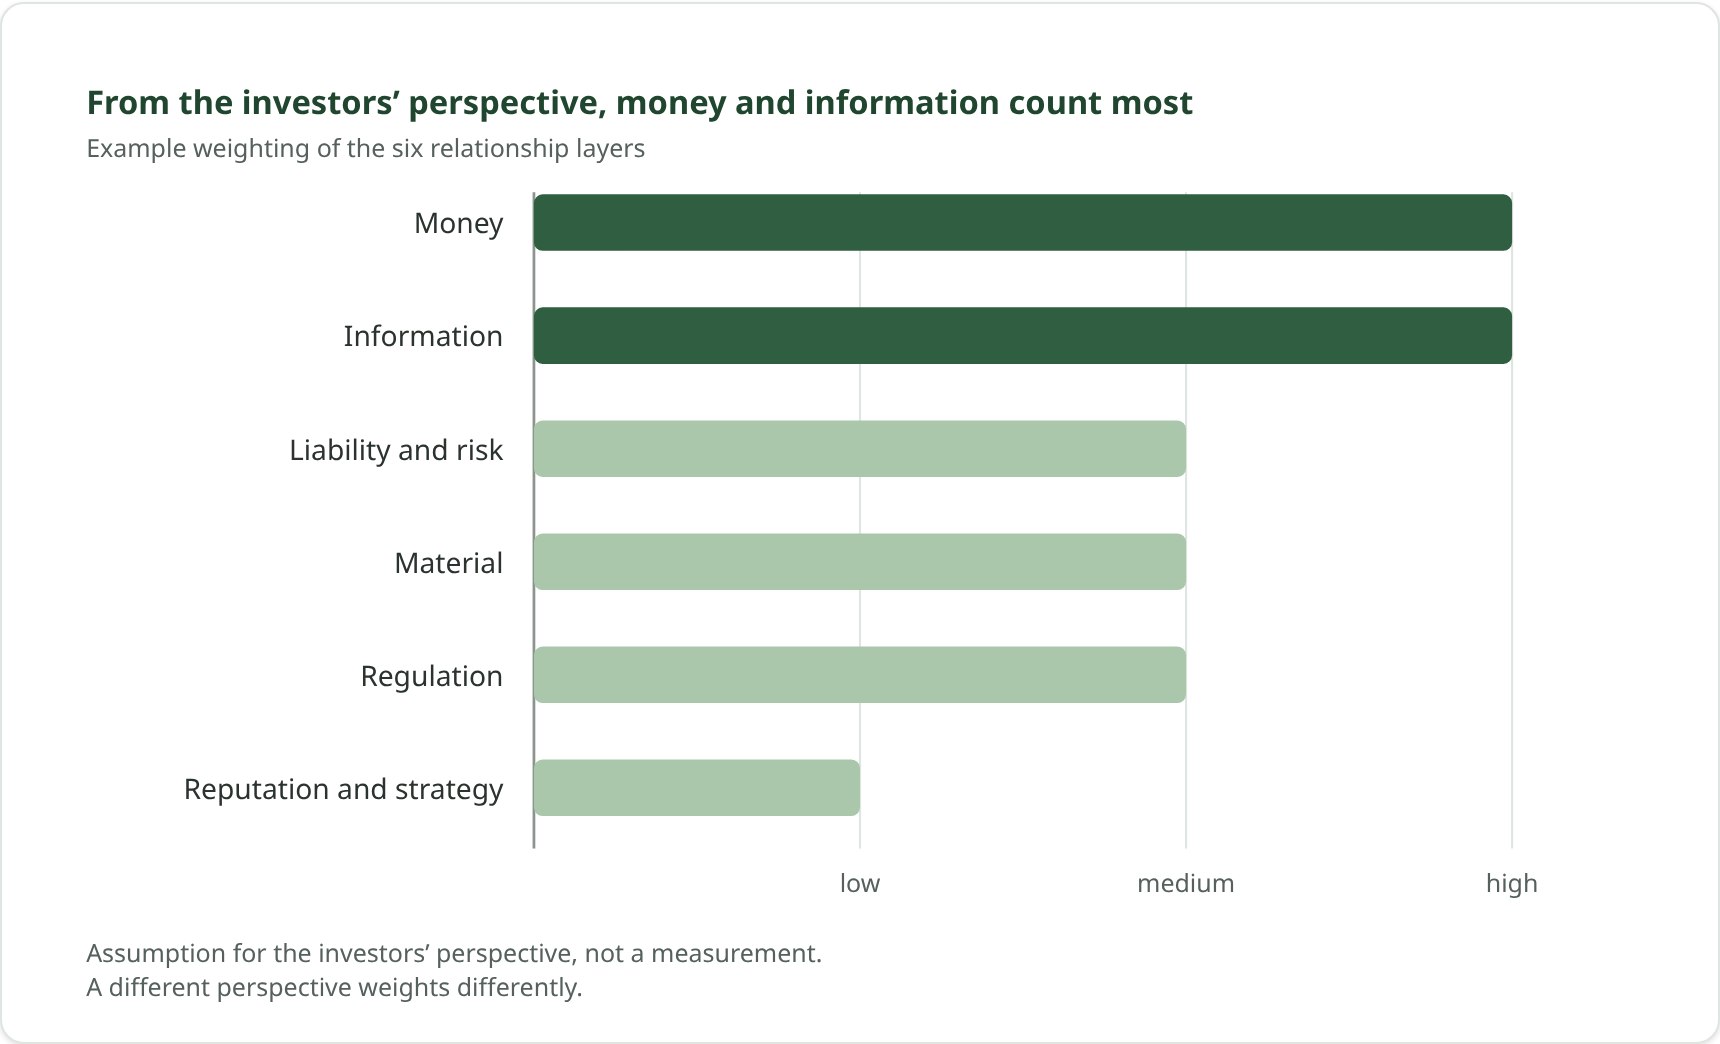
Own assumption, not a measurement. Created with Claude Design Beta (AI).
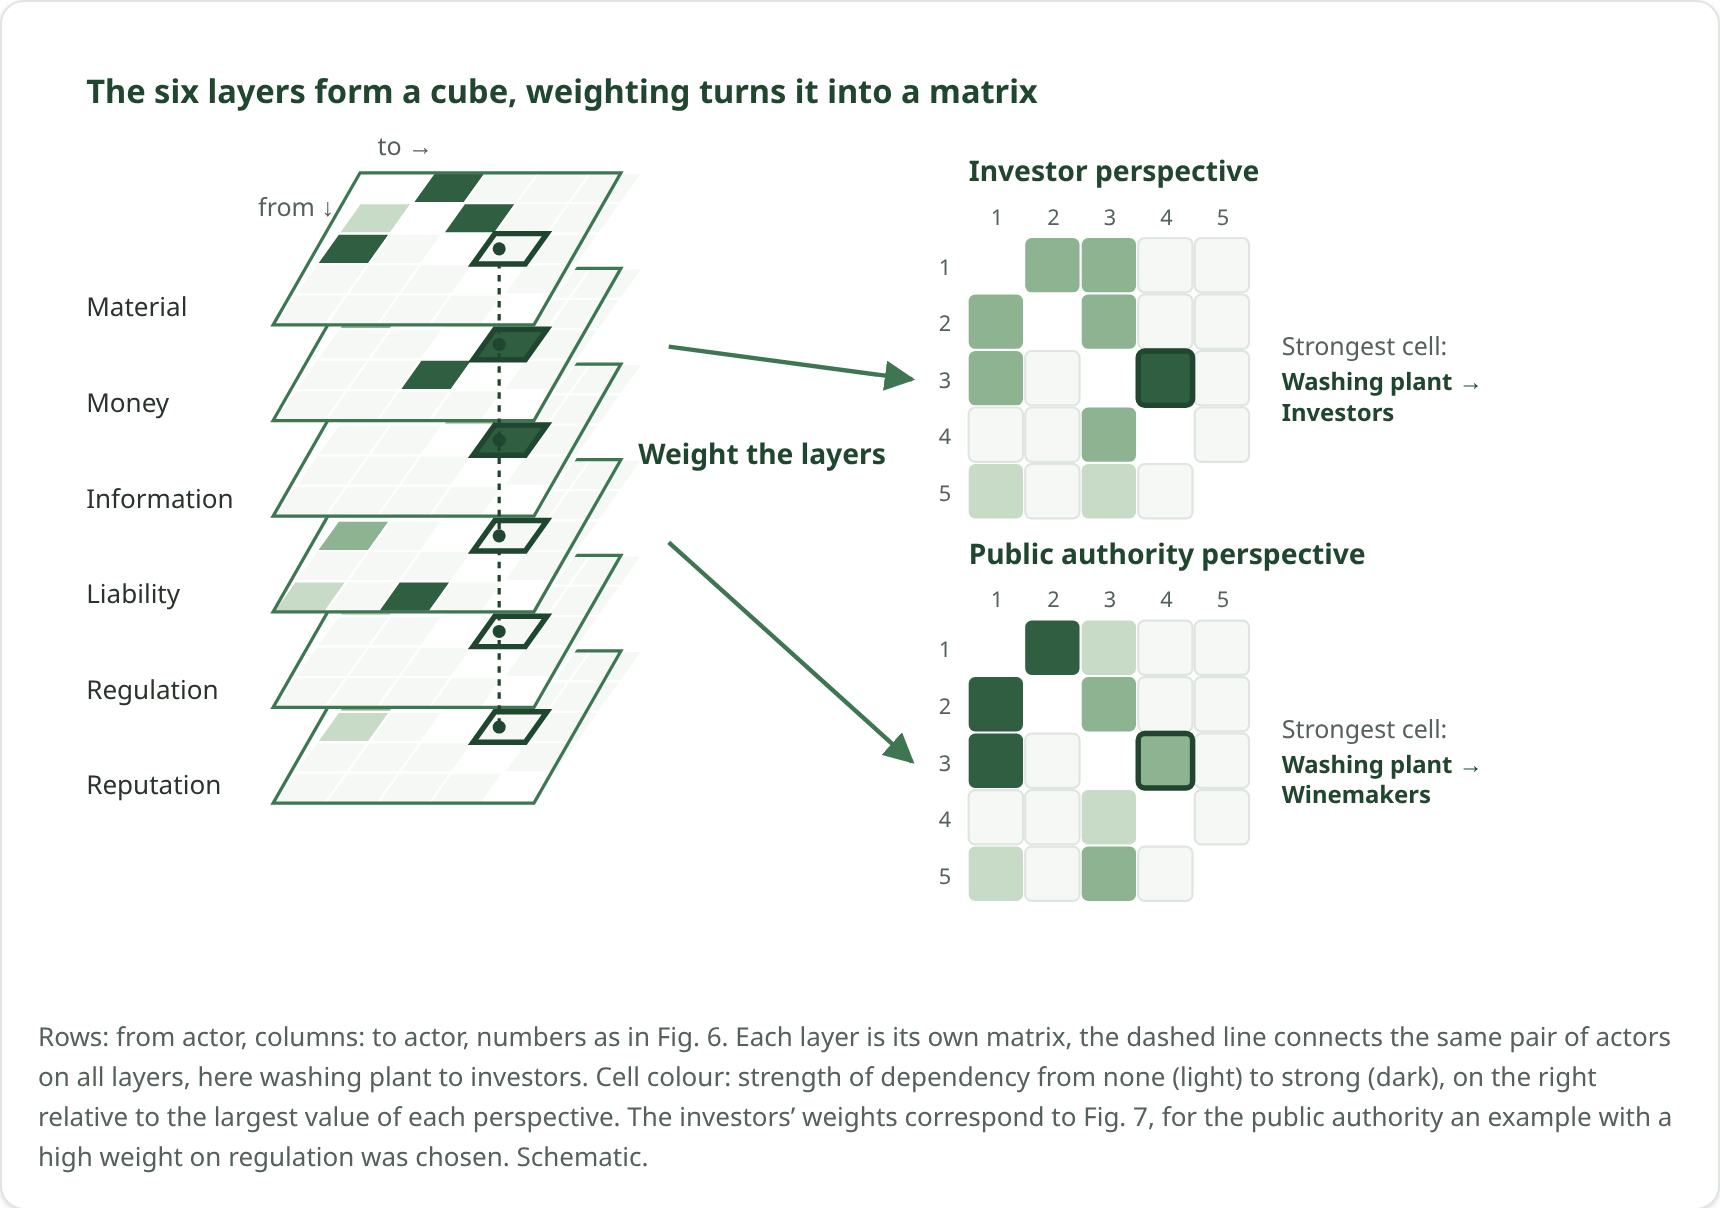
Own illustration, schematic. Created with Claude Design Beta (AI).
Step 6: Assessing the incentive gaps
Now we assess: where does an actor have too little incentive for what the model needs from them? To do this we fill in the matrix. Each cell rates the incentive gap of an actor on a relationship layer, from 0 (none) to 3 (large). Multiplied by the weights from step 5, this gives a weighted gap sum per actor. The values are my assumptions for our example case.
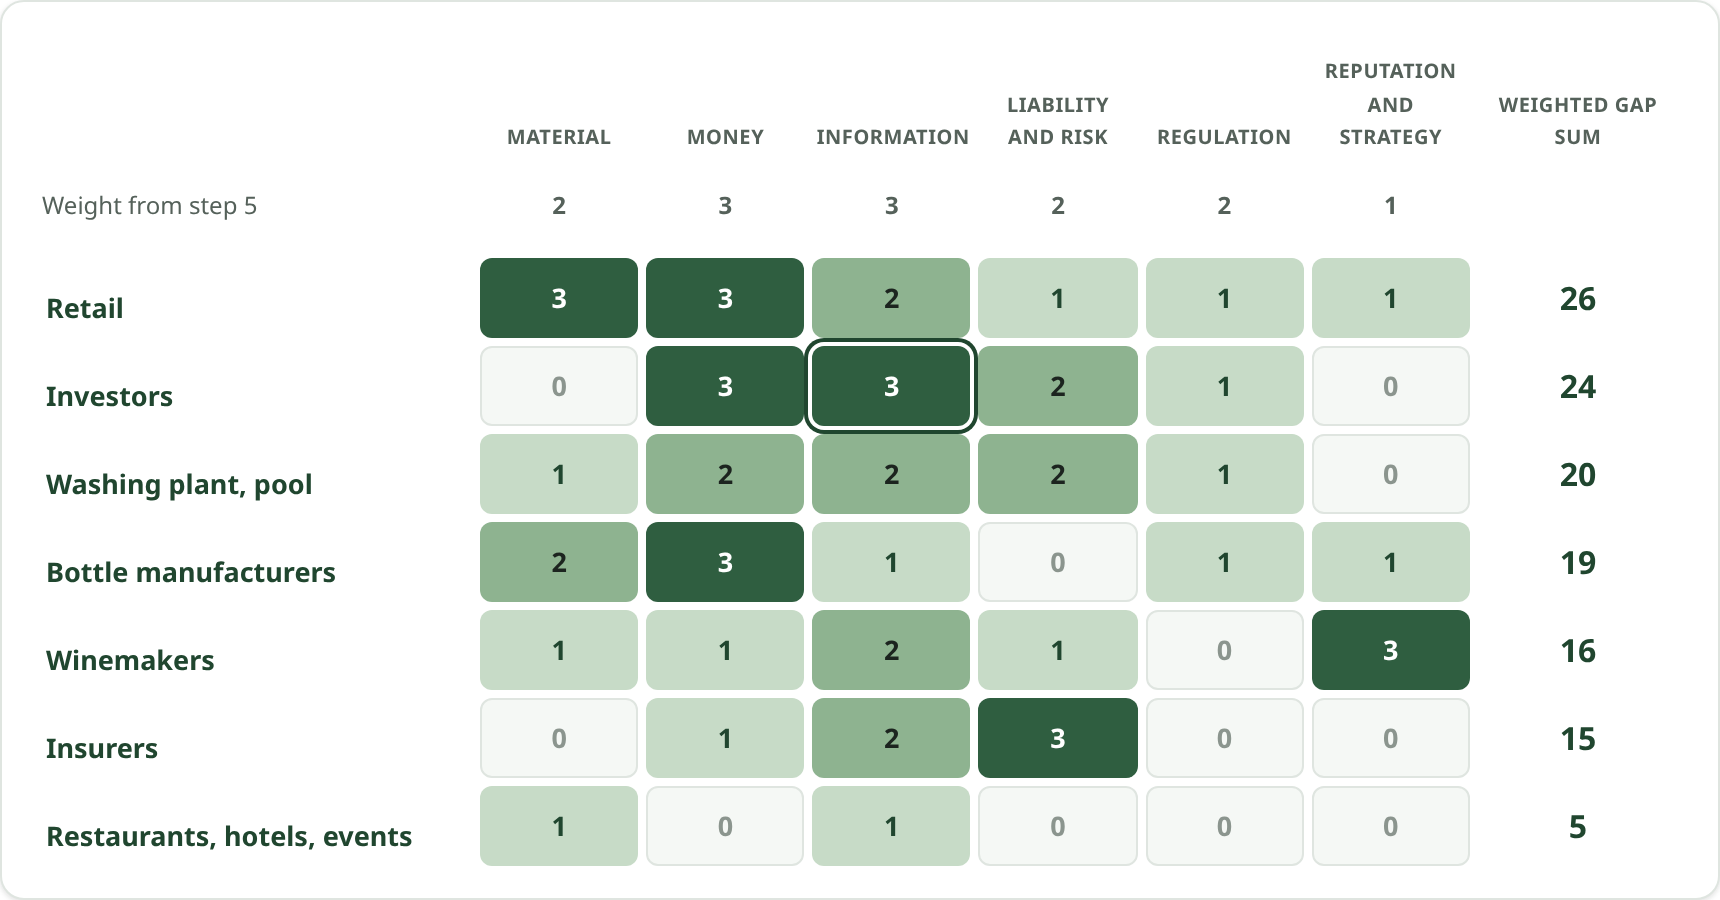
Own illustration. Created with Claude Design Beta (AI).
From this we can derive:
Gaps block each other across layers. Nobody knows the number of cycles (information). Without it, investors cannot calculate a residual value (money). Without capital the pool has no utilisation, and without utilisation no volume comes together. A measure on the information layer therefore closes several gaps on the money layer at once. You see this cross-connection in the matrix, not in a list of actors.
The largest gap is not the critical path. Retail has by far the largest weighted gap sum. A stakeholder analysis would conclude: win over retail first. The matrix shows something else. The loop of winemakers, hospitality and washing plant does not need retail to get started, and the hospitality row is almost empty. Starting with retail means solving the hardest problem first. Starting with hospitality means solving the smallest.
The same as a network: the graphic shows seven actors and the relationship where things get stuck in each case. Here, too: self-set assumptions for our example case.
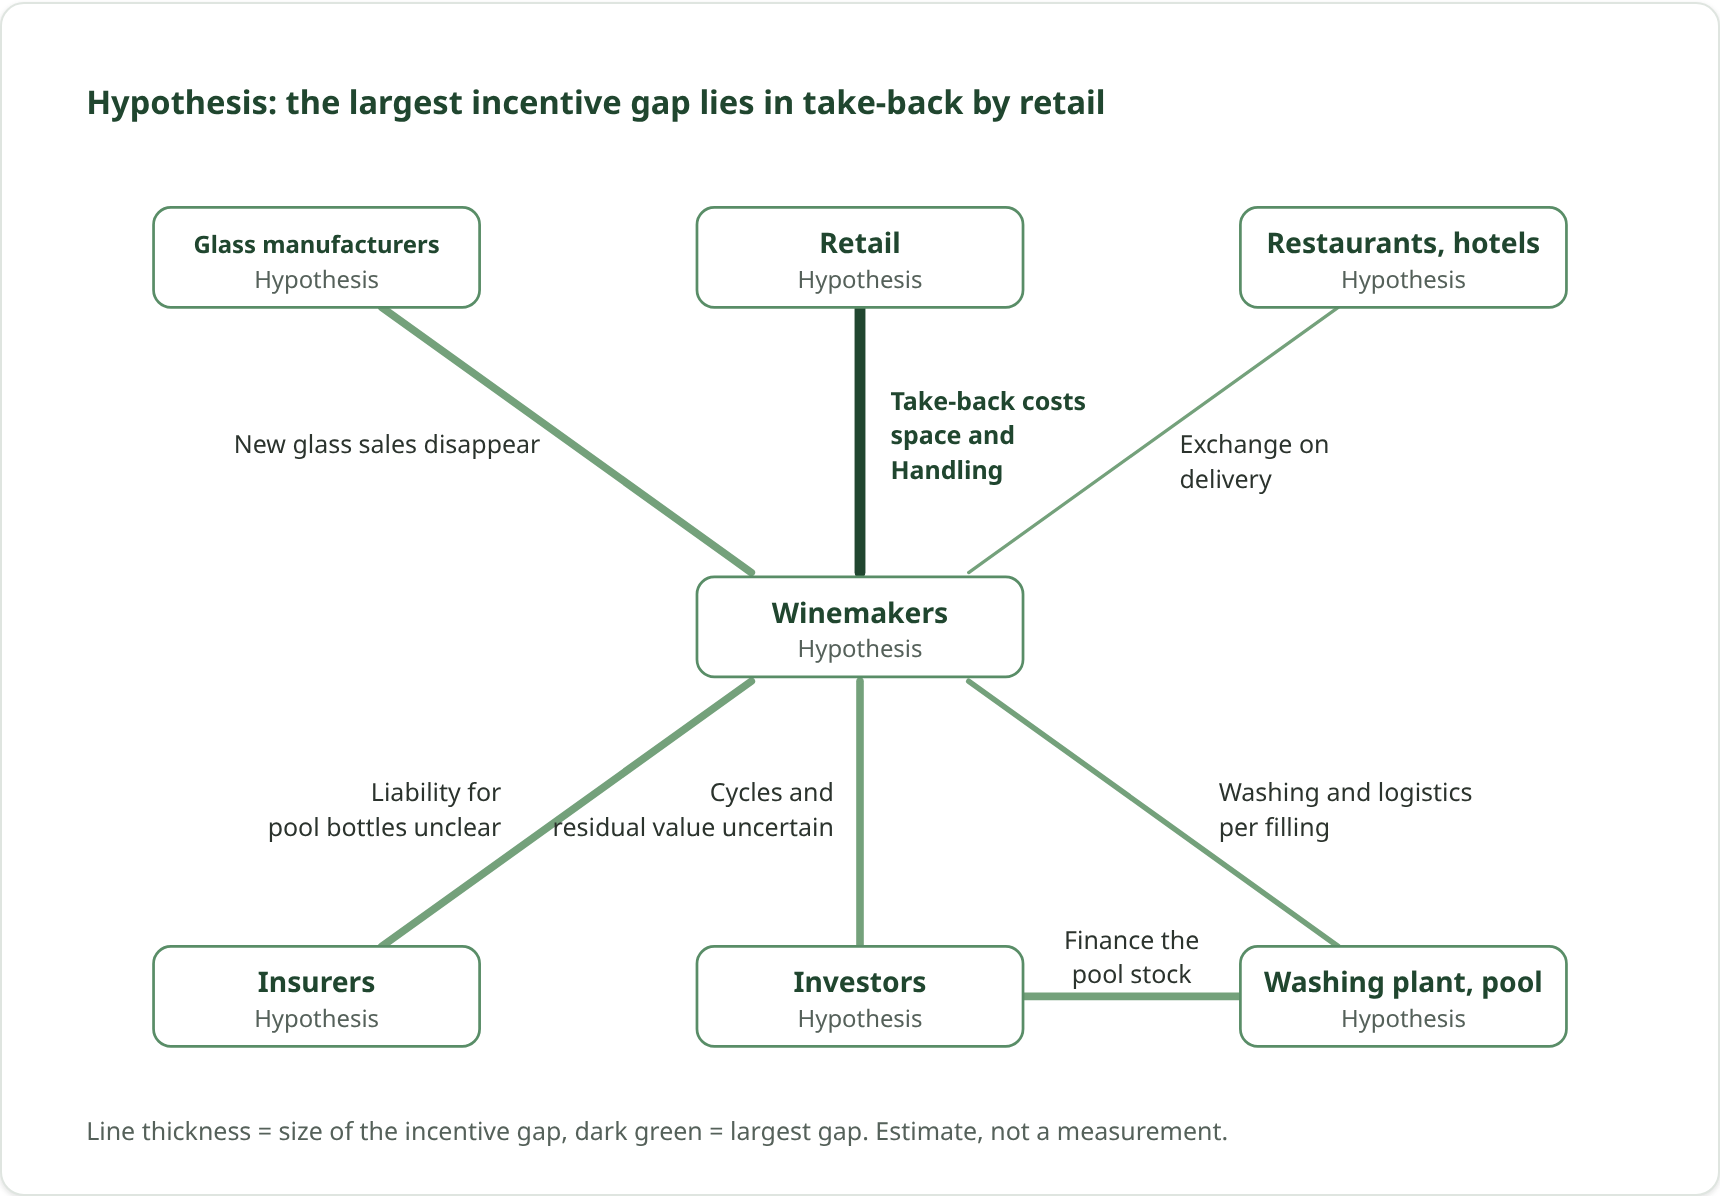
Own illustration. Created with Claude Design Beta (AI).
Our assessment of the actors at a glance:
| Actor | What the loop needs | Impediments |
|---|---|---|
| Bottle manufacturers | Giving up new glass sales or a new role as pool supplier | Reuse threatens the core business |
| Winemakers | Standard bottle, return, trust in quality | The bottle is part of the packaging. Concern about hairline cracks and oxygen ingress, to be checked technically |
| Retail | Take-back within the existing deposit system | Space and handling for an additional collection |
| Restaurants, hotels, events | Hand over empties on delivery | Hardly any hurdles: few pick-up points, exchange on delivery possible |
| Insurers | Cover for pool bottles and liability | Risk not yet clearly assessable |
| Washing plant, pool | Utilisation and capital | Chicken-and-egg problem: no volume, no utilisation; no utilisation, no capital |
| Investors | Financing the pool stock | Number of cycles and residual value uncertain |
This is offset by effects that do not accrue to the investors: value creation in the country through washing plants and regional transport, and less dependence on glass imports. Subsidies and extended producer responsibility are possible levers. How reuse is treated there today is something I am still checking.
Step 7: Measures
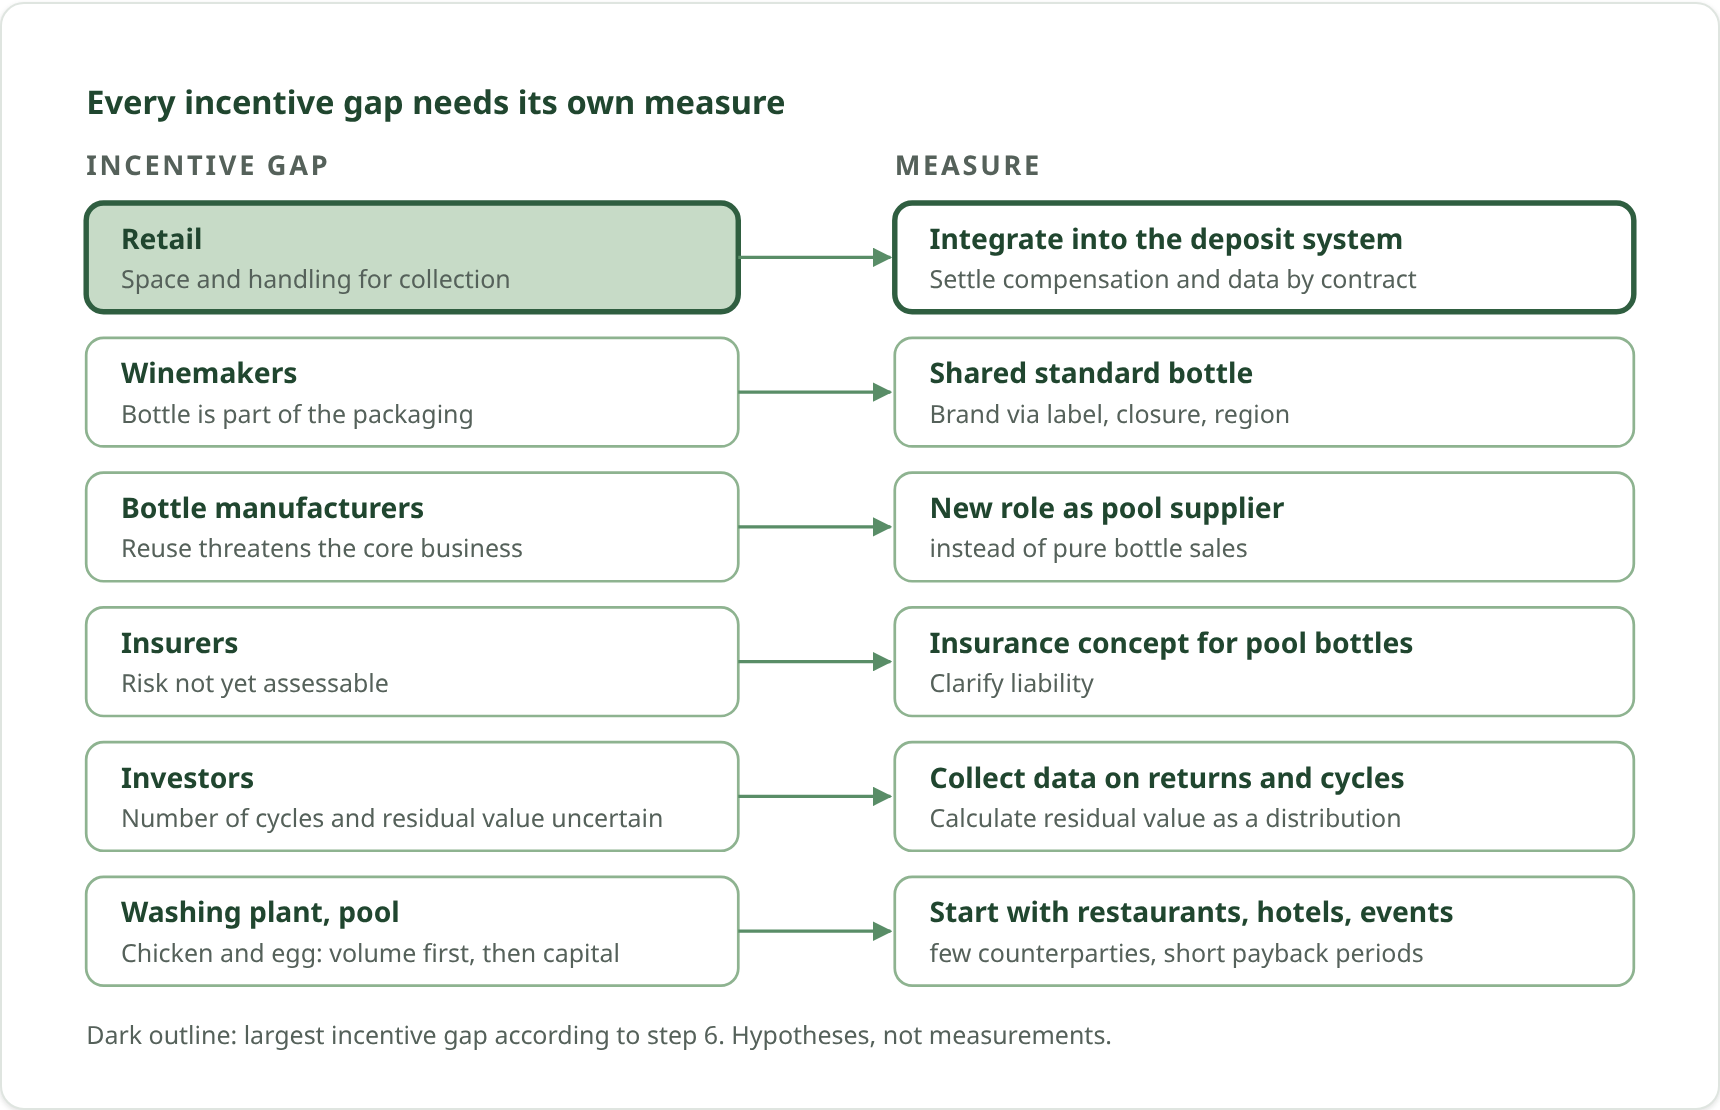
With a better understanding of the incentive gaps, we can finally consider which mechanisms we can use to create new incentives.
Own illustration. Created with Claude Design Beta (AI).
Start with restaurants, hotels and events. Few counterparties, short payback periods, exchange on delivery, no retail in between. The edges are sparse and the cash flows predictable. For investors this is the strongest entry point.
Protect the standard. A shared bottle carries the pool, as the 2005 Styrian study also suggests. Brand is then expressed through the label, closure and region, not through the shape of the bottle.
Treat retail as an option, not as the foundation. Integration into the existing deposit system takes priority over separate collection points. Compensation and data should be settled by contract.
Close the data gap. Who can see how many bottles are in circulation and where they end up? Without this figure there is no residual value distribution and therefore no financing.
All assessments in this example are hypotheses. Reliable data is missing for glass manufacturers, retail and insurers, as well as on the actual number of cycles for wine and on whether hairline cracks affect wine quality.
Outlook
The analogy is early and still immature. It is a first proposal for a new approach to analysis and solution development. What matters is to apply the concept to real cases as quickly as possible and to develop it further in a practical way. We want to discuss weights and incentive gaps with the actors of a real case and see whether they hold up when those affected see them for themselves.
If it holds, it becomes a consulting tool: a template and a spreadsheet model that can be transferred to other cases, for example in financing and structuring circular models. Open questions include how much standardisation a single case can take, whether the derived measures can actually be implemented, and much more.
In the long term the question is whether an algorithm or software, with a data model, simulation and eventually weights learned from deal data instead of estimated, is realistic.
Do you have feedback on the analogy or the method, data, or a case on which we could test this? Then get in touch with me at felix.ambros@thinkubator.earth.
Sources
- Vaswani, A. et al. (2017): Attention Is All You Need. Advances in Neural Information Processing Systems 30.
- Land Steiermark, Fachabteilung 19D, Abfall- und Stoffflusswirtschaft (2005): Ökologischer und ökonomischer Vergleich von Mehrweg- und Einwegverpackungen am Beispiel Mineralwasser (Verena Reiterer). [Ecological and economic comparison of reusable and single-use packaging using mineral water as an example, in German.]
- Landi, D., Germani, M., Marconi, M. (2019): Analyzing the environmental sustainability of glass bottles reuse in an Italian wine consortium. Procedia CIRP 80, pp. 399 to 404. doi:10.1016/j.procir.2019.01.054
- Rli (2015): Circular economy. From intention to implementation (in Dutch; Rli 2015/03, NUR-740, ISBN 978-90-77323-00-7). Council for the Environment and Infrastructure (Rli), The Hague. 10R strategies graphic based on Rli, edited by PBL.
The assessments in the case study are our own assumptions, not verified results.
This English version was translated with Claude Opus 5.5 from the German original (AI translation).